Dotsider 0.18.1
See the version list below for details.
dotnet tool install --global Dotsider --version 0.18.1
dotnet new tool-manifest
dotnet tool install --local Dotsider --version 0.18.1
#tool dotnet:?package=Dotsider&version=0.18.1
nuke :add-package Dotsider --version 0.18.1
Dotsider
A TUI for analyzing .NET assemblies — structure, metadata, IL, strings, dependencies, and more. Inspired by binsider for ELF binaries, built for the .NET ecosystem.
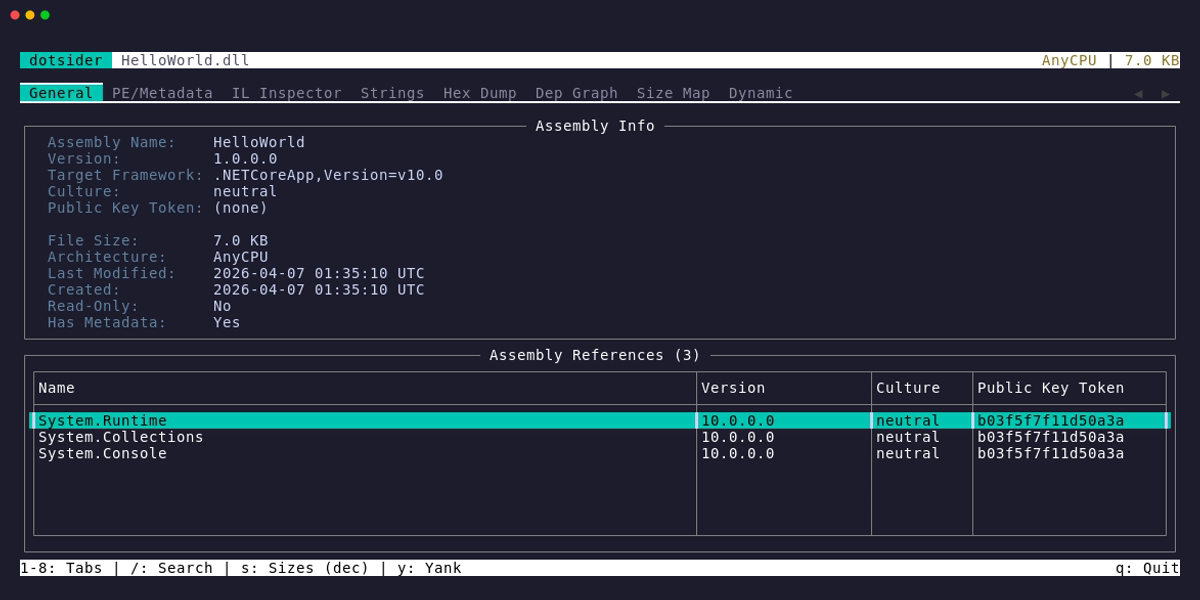
dotsider HelloWorld.dll
Installation
dotnet tool (recommended)
dotnet tool install -g dotsider
Homebrew (macOS / Linux)
brew install willibrandon/tap/dotsider
WinGet (Windows)
winget install willibrandon.dotsider
Scoop (Windows)
scoop bucket add dotsider https://github.com/willibrandon/scoop-bucket
scoop install dotsider
Download binary
Grab a standalone binary from Releases.
What it does
dotsider opens any .NET DLL or EXE and lets you explore it across 8 tabs. Apphost executables are handled as first-class inputs: when an .exe has no .NET metadata, dotsider offers to open the companion managed .dll. Self-contained single-file apps work too — dotsider reads the bundle, extracts the entry assembly, and analyzes it directly.
Native AOT binaries get native treatment instead of an empty metadata view. dotsider validates the embedded ReadyToRun header, walks the runtime sections, surfaces imports, exports, load config, recovered AOT types, recovered methods, and frozen string literals, then renders x86-64 or AArch64 disassembly for native functions.
When the Native AOT build tree is available, dotsider can attach the pre-ILC managed assemblies plus their mstat/DGML sidecars. That fills the metadata tabs from the original managed inputs and shows each method's IL beside its native code.
ReadyToRun (crossgen2) images keep their full managed metadata, and dotsider joins that metadata to the precompiled method bodies in the same file or composite image. You can see IL beside native code, named call targets from import tables, and component assemblies followed in both directions.
| Tab | What you see |
|---|---|
| 1 General | Assembly identity, target framework, architecture, dependency table. Press Enter on a reference to drill into it. |
| 2 PE/Metadata | COFF headers, CLR header, sections, TypeDefs, MethodDefs, AssemblyRefs, custom attributes, resources, debug directory, native imports, exports, load config, ReadyToRun sections, and recovered AOT types. Press g on a TypeDef or MethodDef to jump to its IL. |
| 3 IL Inspector | Namespace/Type/Method tree with IL disassembly. Portable PDBs add source spans, Source Link markers, and local names when available. Press u on a [source link] marker to copy its resolved URL. Press Enter or gd on a call, ldfld, newobj, etc. to go to the target — works across assemblies. Press Esc to go back. Press x to jump to the method body in the hex dump. For a Native AOT binary the same tree lists recovered functions and the right pane shows real x86-64 or AArch64 disassembly (a from-scratch, VEX/EVEX-aware x64 decoder and an A64 decoder incl. SVE), with call/branch/data targets resolved to names, Foo+0x12, loc_… labels, and MODULE!Function imports. For a ReadyToRun image the tree keeps its managed shape, a glyph marks the precompiled methods, and the right pane shows the method's IL beside its native code ranges (hot, funclets, cold). |
| 4 Strings | User strings, metadata strings, raw ASCII and UTF-16 binary scans, and frozen AOT string literals, with configurable minimum length. |
| 5 Hex Dump | Hex editor with vi-style modal editing (read-only by default), byte category coloring, data interpretation panel, jump-to-offset, and vim navigation. |
| 6 Dep Graph | Visual dependency graph — your assembly at the root, references as nodes, edge weights by TypeRef count. Press Enter on a node to open that assembly. |
| 7 Size Map | Treemap of code size — Assembly > Namespace > Type > Method, sized by IL byte count. Click to drill in; Enter on a method leaf jumps to its IL. |
| 8 Dynamic | Launch the assembly and trace it live via EventPipe — GC events, JIT compilations, exceptions, performance counters, stdout. Press Enter on a JIT event to jump to that method's IL. |
Additional modes
dotsider diff v1.dll v2.dll             # side-by-side assembly comparison
dotsider diff before.mstat after.mstat  # Native AOT size diff — delta treemap of two builds
dotsider package.nupkg                  # browse NuGet package contents, inspect any DLL inside
Building
Requires .NET 10 SDK.
dotnet build
The binary lands at src/Dotsider/bin/Debug/net10.0/dotsider.
Usage
dotsider <assembly.dll|.exe>    # TUI mode — interactive assembly explorer
dotsider <package.nupkg>        # TUI mode — browse NuGet package contents
dotsider diff <left> <right>    # TUI mode — assembly comparison; AOT size diff for mstat inputs

dotsider analyze <file> [opts]  # CLI mode — headless analysis to stdout or file
dotsider size-check <target>    # CLI mode — AOT size regression report and CI budget gate
dotsider sessions <command>     # CLI mode — interact with running dotsider instances
dotsider agent init [opts]      # CLI mode — generate AI skill file for a provider
dotsider agent mcp              # CLI mode — launch the dotsider MCP server

TUI options:
  -t, --tab <1-8>               start on a specific tab
  -n, --min-len <n>             minimum raw string length (default: 4)
  -v, --version                 show version
  -h, --help                    show help
CLI: dotsider analyze
Run analysis without the TUI — pipe to other tools, write to files, or output JSON for scripting.
dotsider analyze MyLib.dll                      # assembly info (default)
dotsider analyze MyLib.dll --types              # list type definitions
dotsider analyze MyLib.dll --methods            # list method definitions
dotsider analyze MyLib.dll --il Type.Method     # disassemble a method
dotsider analyze MyAotApp.exe --symbols         # list native symbols (Native AOT / native binaries)
dotsider analyze MyAotApp.exe --disasm 'Program.<Main>$'  # disassemble a native function (name or 0xVA)
dotsider analyze MyAotApp.exe --correlate       # correlate with pre-ILC assembly (counts)
dotsider analyze MyAotApp.exe --correlate Type.Method  # IL and native code side by side (name or 0xVA)
dotsider analyze MyR2RApp.dll --r2r-correlate   # ReadyToRun stats (precompiled methods, composite)
dotsider analyze MyR2RApp.dll --r2r-correlate Type.Method  # IL beside precompiled native (name or 0xVA)
dotsider analyze MyLib.dll --embedded-source Type.Method # print embedded source
dotsider analyze MyLib.dll --deps               # assembly references
dotsider analyze MyLib.dll --strings            # extract strings
dotsider analyze MyLib.dll --fields             # list field definitions
dotsider analyze MyLib.dll --size               # size breakdown
dotsider analyze MyLib.dll --bundle             # show single-file bundle manifest
dotsider analyze MyLib.dll --json               # any of the above as JSON
dotsider analyze MyLib.dll --types -o out.txt   # write to file
dotsider analyze MyApp.exe                      # apphost .exe → auto-redirects to MyApp.dll
dotsider analyze MyApp                          # single-file bundle → extracts and analyzes entry assembly
CLI: dotsider size-check
Native AOT size-regression checking for CI: compare a build against a baseline via their
mstat size reports (IlcGenerateMstatFile), enforce size budgets, and exit non-zero when one
breaks. Inputs are bare .mstat files or AOT binaries with the sidecar beside them.
dotsider size-check out/pr/app --baseline baseline/app.mstat            # delta report, exit 0
dotsider size-check out/pr/app --baseline baseline/app.mstat \
  --budget total:growth=1% --budget ns=MyApp.Generated:growth=0         # gate: exit 2 on breach
dotsider size-check out/pr/app --baseline baseline/app.mstat \
  --format markdown --summary-file "$GITHUB_STEP_SUMMARY"               # GitHub step summary
dotsider size-check out/pr/app --budget max=25mb                        # absolute cap, no baseline
Budgets: [scope:]limit(,limit)* — scope total / ns=<Namespace> (covers sub-namespaces) /
asm=<Assembly>; limits max=SIZE and growth=SIZE|PERCENT (25mb, 10kb, 1%).
--budget-file adds a JSON document whose object entries carry names, descriptions,
severity: "warning" (reported, never fails), and per-budget contributor counts. --why
attaches the ILC dependency chain for top added contributors. Exit codes: 0 pass, 1 error,
2 budget exceeded.
CLI: dotsider sessions
Interact with running dotsider TUI instances. Each instance exposes a Unix domain socket for programmatic access.
dotsider sessions list                          # list running instances
dotsider sessions info <pid>                    # assembly info + current view
dotsider sessions view <pid>                    # current tab and view state
dotsider sessions navigate <pid> <tab>          # switch to tab (1-8)
dotsider sessions capture <pid>                 # capture screen as plain text
dotsider sessions trace start <pid>             # start tracing the loaded assembly
dotsider sessions trace events <pid>            # get JIT, GC, exception events
dotsider sessions trace counters <pid>          # get performance counters
dotsider sessions trace output <pid>            # get stdout/stderr from traced process
dotsider sessions trace stop <pid>              # stop the active trace
CLI: dotsider agent
MCP server management and AI skill file generation.
dotsider agent mcp                              # launch the dotsider MCP server
dotsider agent init --ai claude                 # generate skill file for a provider
dotsider agent init --path ./SKILL.md           # write to an explicit path
dotsider agent init --stdout                    # print skill content to stdout
Supported --ai providers: claude, gemini, copilot, cursor-agent, opencode, codex, windsurf, kilocode, amp, qwen. Each resolves to the provider's conventional skill path relative to the current directory.
Keyboard
| Key | Action |
|---|---|
1-8 |
Switch tabs |
Enter |
Drill into selected item (assembly ref, method, DLL in package) |
Esc |
Go back (assembly stack, breadcrumb, or cross-view jump) |
y |
Yank (copy) — selected text in editors, or focused row in tables |
yy |
Yank entire line under cursor |
V |
Select entire line under cursor |
iw |
Select inner word (vim text object) |
iW |
Select inner WORD (whitespace-delimited — grabs fully-qualified names) |
yiw / yiW |
Select + yank word/WORD in one motion |
Tab |
Cycle focus between info panels and tables |
Enter / gd |
Go to definition (IL Inspector tab, cursor on a token-bearing instruction) |
g |
Go to IL Inspector for the focused TypeDef/MethodDef (PE/Metadata tab) |
u |
Copy Source Link URL from a [source link] marker in the IL Inspector |
x |
Jump to method body in Hex Dump (IL Inspector tab, when a method with RVA is selected) |
/ |
Search (highlights matches inline) |
n / N |
Next / previous search match |
s |
Toggle human-readable sizes |
q |
Quit |
Info panels (Assembly Info, PE Headers, CLR Header, detail popups, string details) are selectable read-only editors. Click or Tab into them, select text with Shift + arrow keys, and press y to copy. For word-level selection without the mouse, iw selects the word under the cursor and iW selects the full whitespace-delimited token — yiw copies it in one keystroke. V selects the entire line and yy copies the entire line in one motion.
Hex Dump tab uses vi-style modal editing — the editor starts in normal mode (read-only) to prevent accidental writes:
| Key | Mode | Action |
|---|---|---|
i |
Normal | Enter insert mode (enables byte editing) |
Esc |
Insert | Return to normal mode |
h j k l |
Normal | Vim-style cursor movement |
g |
Normal | Jump to hex offset |
e |
Normal | Toggle endianness (LE/BE) |
Ctrl+T |
Any | Toggle text/hex search mode |
Ctrl+S |
Normal | Save edited bytes (only when modified) |
In insert mode, type two hex digits (0-9, a-f) to overwrite one byte. The first digit sets the high nibble; the second commits the edit. Saving validates the PE image before writing — invalid edits are rejected.
Diff mode adds f to cycle filters (All / Added / Removed / Changed). The size-diff view (mstat inputs) adds Grown and Shrunk to the filter cycle, Enter/Esc to drill and back out of the delta treemap, w for the dependency chain that keeps an entry in the binary (aggregate tiles show representative child chains; press again to flip sides on a changed entry), and d to disassemble a method's native body. NuGet mode uses Esc to return from DLL inspection to the package browser.
How it works
dotsider starts with the low-level APIs that ship with .NET, then layers its own readers on top for the binary formats the runtime libraries do not expose directly:
System.Reflection.MetadataprovidesMetadataReaderfor traversing ECMA-335 metadata tables (types, methods, references, custom attributes, string heaps)System.Reflection.PortableExecutableprovidesPEReaderfor PE structure (COFF header, sections, CLR header, method bodies)- Custom Native AOT and ReadyToRun readers parse RTR section tables, recovered NativeFormat metadata, frozen objects, mstat/DGML sidecars, native symbols, and precompiled method maps
- From-scratch x86-64 and AArch64 decoders render native disassembly for AOT and R2R code
System.IO.Compressionhandles NuGet packages (which are just ZIP files containing a.nuspecmanifest and DLLs)
The dynamic analysis tab uses Microsoft.Diagnostics.NETCore.Client to connect to a running .NET process via EventPipe — the same diagnostic infrastructure that powers dotnet-trace and dotnet-counters. It launches your assembly with a reverse-connect diagnostic port, so events are captured from the very first instruction.
The TUI is built on Hex1b, a .NET terminal UI library with a React-inspired declarative API, constraint-based layout, theming, and efficient widget reconciliation.
MCP server
dotsider-mcp is a standalone Model Context Protocol server that exposes dotsider's analysis engine to AI coding assistants like Claude Code, VS Code Copilot, and others.
Install
dotnet tool (recommended)
dotnet tool install -g Dotsider.Mcp
Homebrew (macOS / Linux)
brew install willibrandon/tap/dotsider-mcp
WinGet (Windows)
winget install willibrandon.dotsider-mcp
Scoop (Windows)
scoop install dotsider-mcp
Download binary
Grab a standalone binary from Releases.
Configure
Add to your MCP client configuration (e.g. .mcp.json for Claude Code):
{
  "mcpServers": {
    "dotsider": {
      "command": "dotsider-mcp"
    }
  }
}
What it provides
50 tools across assembly analysis, IL disassembly, native disassembly, Native AOT analysis, portable PDB debug info, metadata inspection, dependency graphs, size analysis, size diffing and budget gating, string extraction, diffing, NuGet package analysis, single-file bundle reading, and runtime tracing. Tools work in two modes:
- Direct mode — pass an assembly path, get results (no TUI needed)
- Session mode — connect to a running dotsider TUI instance via Unix domain socket for live state, tracing, and navigation
5 guided prompts for common workflows: security audit, API surface review, breaking change detection, dependency health analysis, and single-file bundle inspection.
Project structure
src/Dotsider.Core/
  Analysis/           PE reading, metadata extraction, IL disassembly, diffing,
                      dependency graphs, size analysis, runtime tracing,
                      single-file bundle reading, .NET shared framework discovery
  Analysis/Models/    Data types for analysis results
  Protocol/           Request/response types and JSON options for the UDS protocol

src/Dotsider/
  Commands/           CLI subcommands (analyze, sessions, agent)
  Diagnostics/        Unix domain socket listener for TUI state access
  Infrastructure/     Output formatting, session discovery
  Views/              One file per tab — widget trees built each frame
  DotsiderApp.cs      Main app shell (tab panel, key bindings, hints bar)
  DotsiderState.cs    All mutable UI state in one place
  DiffApp.cs          Diff mode shell
  SizeDiffApp.cs      Size-diff mode shell (Native AOT mstat pairs)
  NuGetApp.cs         NuGet mode shell
  Program.cs          CLI entry point and mode routing

src/Dotsider.Mcp/
  Tools/              MCP tool classes (assembly, IL, metadata, deps, size, etc.)
  Prompts/            Guided analysis prompts (security, API review, breaking changes)
  Program.cs          MCP server entry point (stdio transport)

samples/
  HelloWorld/         Minimal console app
  ComplexApp/         Async pipeline with embedded resources
  EmbeddedSourceLib/  Embedded portable PDB source fixture
  RichLibrary/        Library with NuGet deps (Newtonsoft.Json, System.Text.Json)
  RichLibraryV2/      Same library with deliberate API changes (for diff testing)
  MinimalApi/         ASP.NET Core minimal API (web SDK, hosted entry point)
  NativeLib/          Unsafe code, P/Invoke, pointer operations
  EmptyLib/           Minimal library (edge case testing)
  NetFxConsole/       .NET Framework 4.8 console app (Dynamic tab guard testing)
  NativeAotConsole/   NativeAOT-published console app (Dynamic tab tracing tests)
  NativeAotConsoleV2/ Same app rebuilt with deliberate size deltas (AOT size-diff fixture)
  SelfContainedConsole/ Self-contained single-file bundle (bundle reading, resolution tests)
  Dotted.Name.App/    Console app with a dotted assembly name (apphost detection)
  NetFxBindingRedirects/  .NET Framework 4.8 fixture for the netfx binder — GAC, framework
                      runtime dir, binding redirects, codeBase, privatePath, satellite culture.
                      Five sibling projects (OldDep, NewDep, PrivatePathLib, CodeBaseLib,
                      CulturedLib) supply the references the root EXE deploys and resolves.

tests/Dotsider.Tests/
  SampleAssemblyFixture.cs   Builds every sample once and runs the netfx oracle EXE,
                             shared across tests
  *Tests.cs                  Integration tests against real assemblies

tests/Dotsider.Mcp.Tests/
  McpServerTestBase.cs       In-memory MCP server setup for testing
  *Tests.cs                  MCP tool and prompt integration tests
Testing
dotnet test
Integration tests run against real .NET assemblies. The test fixture builds all sample projects automatically. First run takes longer due to NuGet restore; subsequent runs use cache.
Samples
Build the sample assemblies to have something to analyze:
dotnet build samples/RichLibrary
dotsider samples/RichLibrary/bin/Debug/net10.0/RichLibrary.dll
Try diff mode with the two library versions:
dotnet build samples/RichLibraryV2
dotsider diff \
  samples/RichLibrary/bin/Debug/net10.0/RichLibrary.dll \
  samples/RichLibraryV2/bin/Debug/net10.0/RichLibrary.dll
Try the Native AOT size diff with the two AOT builds (publishes with ILC — takes a minute):
dotnet publish samples/NativeAotConsole -c Release
dotnet publish samples/NativeAotConsoleV2 -c Release
dotsider diff \
  samples/NativeAotConsole/bin/Release/net10.0/<rid>/publish/NativeAotConsole.mstat \
  samples/NativeAotConsoleV2/bin/Release/net10.0/<rid>/publish/NativeAotConsole.mstat
License
MIT
| Product | Versions Compatible and additional computed target framework versions. |
|---|---|
| .NET | net10.0 is compatible. net10.0-android was computed. net10.0-browser was computed. net10.0-ios was computed. net10.0-maccatalyst was computed. net10.0-macos was computed. net10.0-tvos was computed. net10.0-windows was computed. |
This package has no dependencies.
| Version | Downloads | Last Updated |
|---|---|---|
| 0.22.0 | 98 | 7/25/2026 |
| 0.21.0 | 134 | 7/9/2026 |
| 0.20.0 | 114 | 7/7/2026 |
| 0.19.0 | 107 | 7/7/2026 |
| 0.18.3 | 111 | 7/7/2026 |
| 0.18.2 | 113 | 7/7/2026 |
| 0.18.1 | 102 | 7/7/2026 |
| 0.18.0 | 106 | 7/6/2026 |
| 0.17.0 | 124 | 6/10/2026 |
| 0.16.0 | 140 | 5/9/2026 |
| 0.15.0 | 121 | 5/3/2026 |
| 0.14.2 | 110 | 5/2/2026 |
| 0.14.1 | 114 | 5/1/2026 |
| 0.14.0 | 129 | 4/26/2026 |
| 0.13.0 | 131 | 4/21/2026 |
| 0.12.2 | 132 | 4/18/2026 |
| 0.12.1 | 135 | 4/17/2026 |
| 0.12.0 | 132 | 4/16/2026 |
| 0.11.1 | 124 | 4/15/2026 |
| 0.11.0 | 136 | 4/9/2026 |