BenchmarkDotNetVisualizer 2.1.0
dotnet add package BenchmarkDotNetVisualizer --version 2.1.0
NuGet\Install-Package BenchmarkDotNetVisualizer -Version 2.1.0
<PackageReference Include="BenchmarkDotNetVisualizer" Version="2.1.0" />
<PackageVersion Include="BenchmarkDotNetVisualizer" Version="2.1.0" />
<PackageReference Include="BenchmarkDotNetVisualizer" />
paket add BenchmarkDotNetVisualizer --version 2.1.0
#r "nuget: BenchmarkDotNetVisualizer, 2.1.0"
#:package BenchmarkDotNetVisualizer@2.1.0
#addin nuget:?package=BenchmarkDotNetVisualizer&version=2.1.0
#tool nuget:?package=BenchmarkDotNetVisualizer&version=2.1.0
Examples:


![]()
![]()
BenchmarkDotNetVisualizer
Visualizes your BenchmarkDotNet benchmarks to Colorful images and Feature-rich HTML (and maybe powerful charts in the future!)
Dark Theme:
Light Theme:
A Real World Demo (.NET Collections Benchmark 🚀)
A Comprehensive Performance Comparison Benchmark Between Different .NET Collections.
https://github.com/mjebrahimi/DotNet-Collections-Benchmark/
Getting Started
1. Install Package
PM> Install-Package BenchmarkDotNetVisualizer
2. Using Methods (Recommended)
Methods:
- SaveAsImageAsync()
- SaveAsHtmlAsync()
- SaveAsHtmlAndImageAsync()
Example:
var summary = BenchmarkAutoRunner.Run<JsonSerializersBenchmark>(); //Prefer to use BenchmarkAutoRunner instead of BenchmarkRunner
//[ProjectDirectory]\Reports\Benchmark-Dark.html
var htmlPath = DirectoryHelper.GetPathRelativeToProjectDirectory(@"Reports\Benchmark-Dark.html");
//[ProjectDirectory]\Reports\Benchmark-Dark.png
var imgPath = DirectoryHelper.GetPathRelativeToProjectDirectory(@"Reports\Benchmark-Dark.png");
var options = new ReportHtmlOptions
{
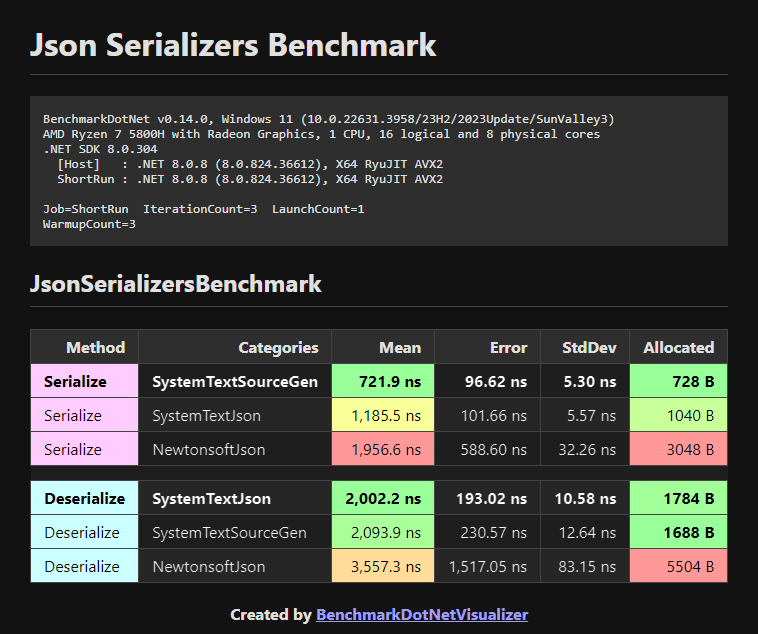
Title = "Json Serializers Benchmark",
GroupByColumns = ["Method"], // Groups by 'Method' column and highlights groups
SpectrumColumns = ["Mean", "Allocated"], // Colorizes 'Mean' and 'Allocated' columns as Spectrum
DividerMode = RenderTableDividerMode.EmptyDividerRow, // Separates tables by Empty Divider Row
HtmlWrapMode = HtmlDocumentWrapMode.Simple, // Uses simple HTML table
Theme = Theme.Dark // Optional (Default is Dark)
};
await summary.SaveAsHtmlAndImageAsync(htmlPath, imgPath, options);
Note: Use BenchmarkAutoRunner to Run your benchmarks
Prefer to use BenchmarkAutoRunner.Run() instead of BenchmarkRunner.Run() to run your benchmarks.
BenchmarkAutoRunner is similar to BenchmarkRunner, but is Smarter!
BenchmarkAutoRunner.Run<JsonSerializersBenchmark>();
// Instead of
//BenchmarkRunner.Run<JsonSerializersBenchmark>();
Output HTML:
Visit this HTML page at samples/JsonSerializersBenchmark/Reports/Benchmark-Dark.html
Output Image:
3. Or Using Exporters
Note: prefer to use previous (recommended) methods.
Exporters:
- [RichImageExporter]
- [RichHtmlExporter]
Example:
BenchmarkAutoRunner.Run<JsonSerializersBenchmark>(); //Prefer to use BenchmarkAutoRunner instead of BenchmarkRunner
//Export to colorful image
[RichImageExporter(
title: "Json Serializers Benchmark",
groupByColumns: ["Method"], // Groups by 'Method' column and highlights groups
spectrumColumns: ["Mean", "Allocated"], // Colorizes 'Mean' and 'Allocated' columns as Spectrum and Sorts the result by them
//format: ImageFormat.Webp or Jpeg // You can set image format (Default is ImageFormat.Png)
//theme: Theme.Dark // Optional (Default is Dark)
)]
//Export to feature-rich HTML
[RichHtmlExporter(
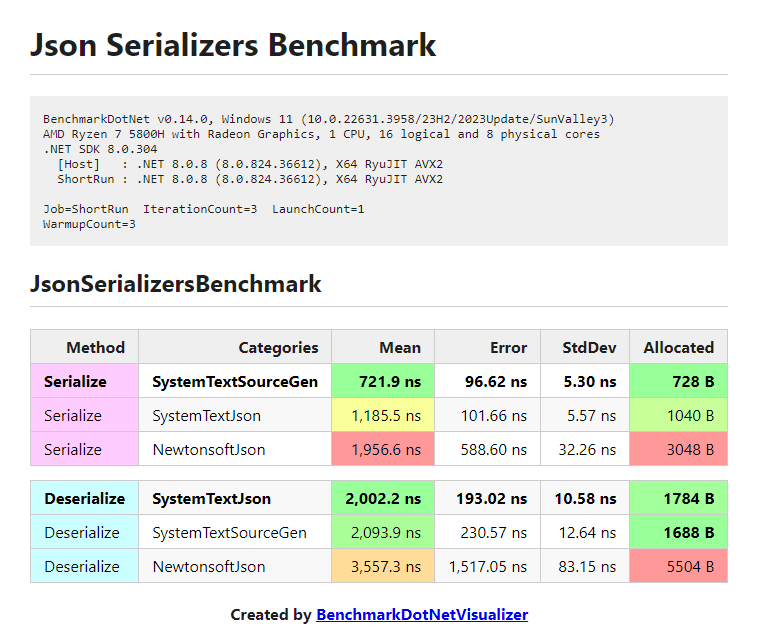
title: "Json Serializers Benchmark",
groupByColumns: ["Method"], // Groups by 'Method' column and highlights groups
spectrumColumns: ["Mean", "Allocated"] // Colorizes 'Mean' and 'Allocated' columns as Spectrum and Sorts the result by them
//sortByColumns: ["Mean", "Allocated"] // You can also sort by other columns as you wish
//theme: Theme.Dark // Optional (Default is Dark)
)]
[MemoryDiagnoser(displayGenColumns: false)] // Displays Allocated column (without GC per Generation columns (Gen 0, Gen 1, Gen 2) due to false option)
public class JsonSerializersBenchmark { ... }
Output:
To see the results, navigate to the following path:
[ProjectDirectory]\bin\[Debug|Release]\[.NET-version]\BenchmarkDotNet.Artifacts\results\Benchmark-report-rich.html|png
For Example:
MyBenchmark\bin\Release\net8.0\BenchmarkDotNet.Artifacts\results\Benchmark-report-rich.pngMyBenchmark\bin\Release\net8.0\BenchmarkDotNet.Artifacts\results\Benchmark-report-rich.html
Using JoinReports method to Join and Pivot your reports
Example:
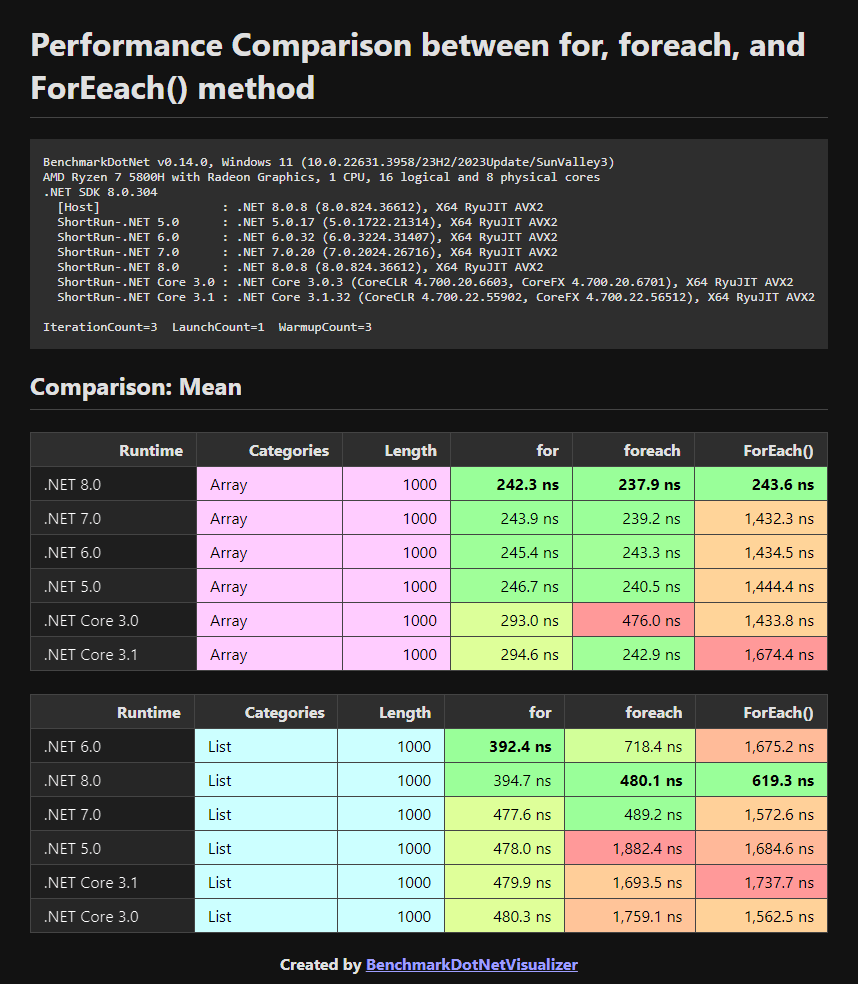
Performance benchmark between for, foreach, and ForEach() in different versions of .NET
Pivot by Method column
var summary = BenchmarkAutoRunner.Run<IterationBenchmark>(); //Prefer to use BenchmarkAutoRunner instead of BenchmarkRunner

//[ProjectDirectory]\Reports\JoinedBenchmark-PivotBy-Method-Dark.html
var htmlPath = DirectoryHelper.GetPathRelativeToProjectDirectory(@"Reports\JoinedBenchmark-PivotBy-Method-Dark.html");

//[ProjectDirectory]\Reports\JoinedBenchmark-PivotBy-Method-Dark.png
var imagePath = DirectoryHelper.GetPathRelativeToProjectDirectory(@"Reports\JoinedBenchmark-PivotBy-Method-Dark.png");

var options = new JoinReportHtmlOptions
{
    Title = "Performance Comparison between for, foreach, and ForEach() method",
    MainColumn = "Runtime",
    GroupByColumns = ["Categories", "Length"],           // Groups by column 'Categories' and 'Length'
    PivotColumn = "Method",                              // Pivot 'Method' column per value of 'Mean'
    StatisticColumns = ["Mean"],                         // Colorizes 'Mean' columns as Spectrum
    ColumnsOrder = ["for", "foreach", "ForEach()"],      // Order of columns
    DividerMode = RenderTableDividerMode.SeparateTables, // Separates tables by Grouping by 'GroupByColumns'
    HtmlWrapMode = HtmlDocumentWrapMode.RichDataTables,  // Uses feature-rich https://datatables.net plugin
    Theme = Theme.Dark                                   // Optional (Default is Dark)
};

await summary.JoinReportsAndSaveAsHtmlAndImageAsync(htmlPath, imagePath, options);
Output HTML:
Visit this HTML page at samples/IterationBenchmark/Reports/JoinedBenchmark-PivotBy-Method-Dark.html
Output Image:
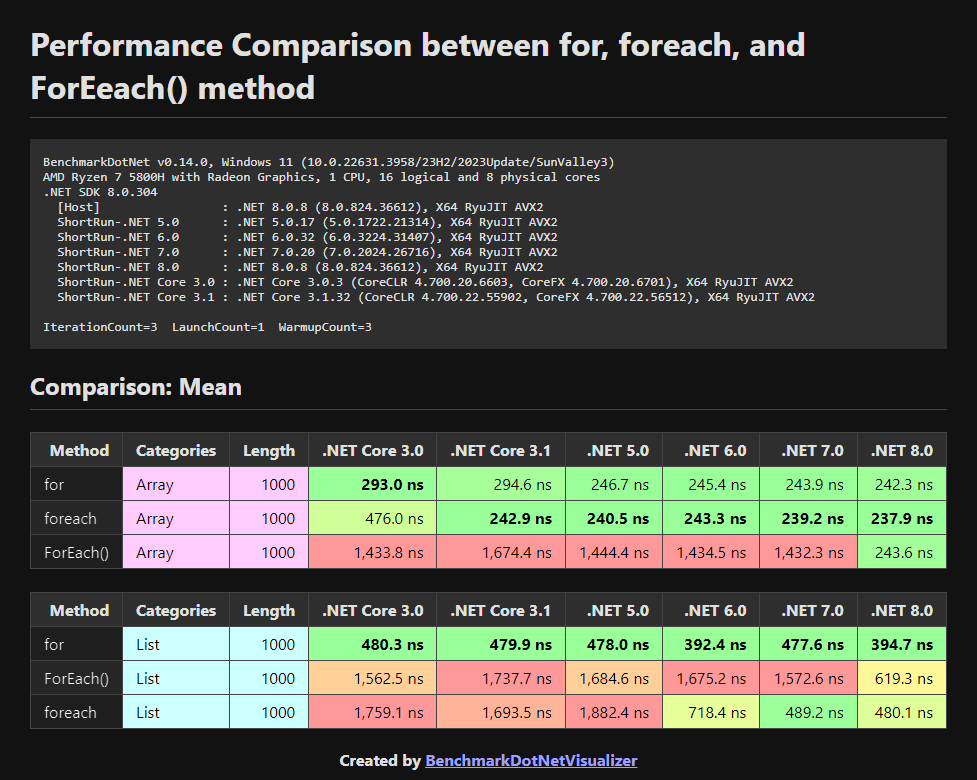
Pivot by .NET Runtime column
var summary = BenchmarkAutoRunner.Run<IterationBenchmark>(); //Prefer to use BenchmarkAutoRunner instead of BenchmarkRunner

//[ProjectDirectory]\Reports\JoinedBenchmark-PivotBy-Runtime-Dark.html
var htmlPath = DirectoryHelper.GetPathRelativeToProjectDirectory(@"Reports\JoinedBenchmark-PivotBy-Runtime-Dark.html");

//[ProjectDirectory]\Reports\JoinedBenchmark-PivotBy-Runtime-Dark.png
var imagePath = DirectoryHelper.GetPathRelativeToProjectDirectory(@"Reports\JoinedBenchmark-PivotBy-Runtime-Dark.png");

var options = new JoinReportHtmlOptions
{
    Title = "Performance Comparison between for, foreach, and ForEach() method",
    MainColumn = "Method",
    GroupByColumns = ["Categories", "Length"],           // Groups by column 'Categories' and 'Length'
    PivotColumn = "Runtime",                             // Pivot 'Runtime' column per value of 'Mean'
    StatisticColumns = ["Mean"],                         // Colorizes 'Mean' columns as Spectrum
    ColumnsOrder = [".NET Core 3.0", ".NET Core 3.1", ".NET 5.0", ".NET 6.0", ".NET 7.0", ".NET 8.0"], //Order of columns
    DividerMode = RenderTableDividerMode.SeparateTables, // Separates tables by Grouping by 'GroupByColumns'
    HtmlWrapMode = HtmlDocumentWrapMode.RichDataTables,  // Uses feature-rich https://datatables.net plugin
    Theme = Theme.Dark                                   // Optional (Default is Dark)
};

await summary.JoinReportsAndSaveAsHtmlAndImageAsync(htmlPath, imagePath, options);
Output HTML:
Visit this HTML page at samples/IterationBenchmark/Reports/JoinedBenchmark-PivotBy-Runtime-Dark.html
Output Image:
Todo
- Chart Visualization
Contributing
Create an issue if you find a BUG or have a Suggestion or Question.
If you want to develop this project :
- Fork it!
- Create your feature branch:
git checkout -b my-new-feature - Commit your changes:
git commit -am 'Add some feature' - Push to the branch:
git push origin my-new-feature - Submit a pull request
Give it a Star! ⭐️
If you find this repository useful and like it, why not give it a star? if not, never mind! 😃
License
Copyright © 2024 Mohammad Javad Ebrahimi under the MIT License.
| Product | Versions Compatible and additional computed target framework versions. |
|---|---|
| .NET | net5.0 was computed. net5.0-windows was computed. net6.0 is compatible. net6.0-android was computed. net6.0-ios was computed. net6.0-maccatalyst was computed. net6.0-macos was computed. net6.0-tvos was computed. net6.0-windows was computed. net7.0 is compatible. net7.0-android was computed. net7.0-ios was computed. net7.0-maccatalyst was computed. net7.0-macos was computed. net7.0-tvos was computed. net7.0-windows was computed. net8.0 is compatible. net8.0-android was computed. net8.0-browser was computed. net8.0-ios was computed. net8.0-maccatalyst was computed. net8.0-macos was computed. net8.0-tvos was computed. net8.0-windows was computed. net9.0 is compatible. net9.0-android was computed. net9.0-browser was computed. net9.0-ios was computed. net9.0-maccatalyst was computed. net9.0-macos was computed. net9.0-tvos was computed. net9.0-windows was computed. net10.0 was computed. net10.0-android was computed. net10.0-browser was computed. net10.0-ios was computed. net10.0-maccatalyst was computed. net10.0-macos was computed. net10.0-tvos was computed. net10.0-windows was computed. |
| .NET Core | netcoreapp3.0 was computed. netcoreapp3.1 was computed. |
| .NET Standard | netstandard2.1 is compatible. |
| MonoAndroid | monoandroid was computed. |
| MonoMac | monomac was computed. |
| MonoTouch | monotouch was computed. |
| Tizen | tizen60 was computed. |
| Xamarin.iOS | xamarinios was computed. |
| Xamarin.Mac | xamarinmac was computed. |
| Xamarin.TVOS | xamarintvos was computed. |
| Xamarin.WatchOS | xamarinwatchos was computed. |
-
.NETStandard 2.1
- BenchmarkDotNet (>= 0.14.0)
- DeepCloner (>= 0.10.4)
- PuppeteerSharp (= 18.1.0)
- SixLabors.ImageSharp (= 2.1.10)
- System.ComponentModel.Annotations (>= 5.0.0)
-
net6.0
- BenchmarkDotNet (>= 0.14.0)
- DeepCloner (>= 0.10.4)
- PuppeteerSharp (>= 20.1.3)
- SixLabors.ImageSharp (>= 3.1.7)
-
net7.0
- BenchmarkDotNet (>= 0.14.0)
- DeepCloner (>= 0.10.4)
- PuppeteerSharp (>= 20.1.3)
- SixLabors.ImageSharp (>= 3.1.7)
-
net8.0
- BenchmarkDotNet (>= 0.14.0)
- DeepCloner (>= 0.10.4)
- PuppeteerSharp (>= 20.1.3)
- SixLabors.ImageSharp (>= 3.1.7)
-
net9.0
- BenchmarkDotNet (>= 0.14.0)
- DeepCloner (>= 0.10.4)
- PuppeteerSharp (>= 20.1.3)
- SixLabors.ImageSharp (>= 3.1.7)
NuGet packages
This package is not used by any NuGet packages.
GitHub repositories (1)
Showing the top 1 popular GitHub repositories that depend on BenchmarkDotNetVisualizer:
| Repository | Stars |
|---|---|
|
mjebrahimi/EasyCompressor
⚡An Easy-to-Use and Optimized compression library for .NET that unified several compression algorithms including LZ4, Snappy, Zstd, LZMA, Brotli, GZip, ZLib, and Deflate. This library aids in Improving Performance by Reducing Memory Usage and Bandwidth Usage. Along with a greate Performance Benchmark between different compression algorithms.
|